It’s Alive! Videographic Frankenstein


ItsAlive-550

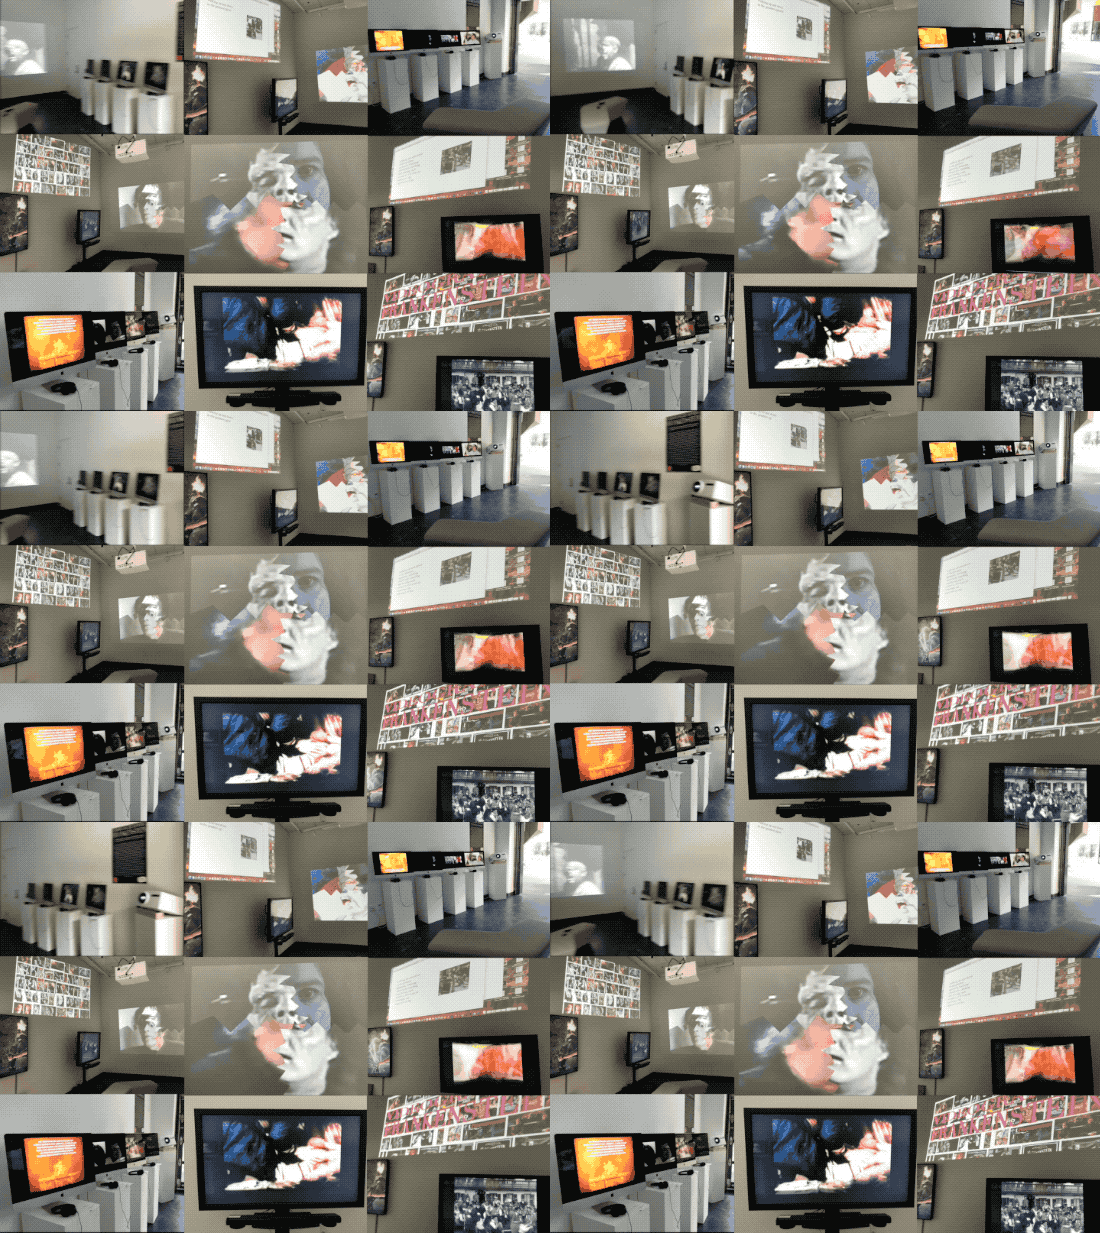
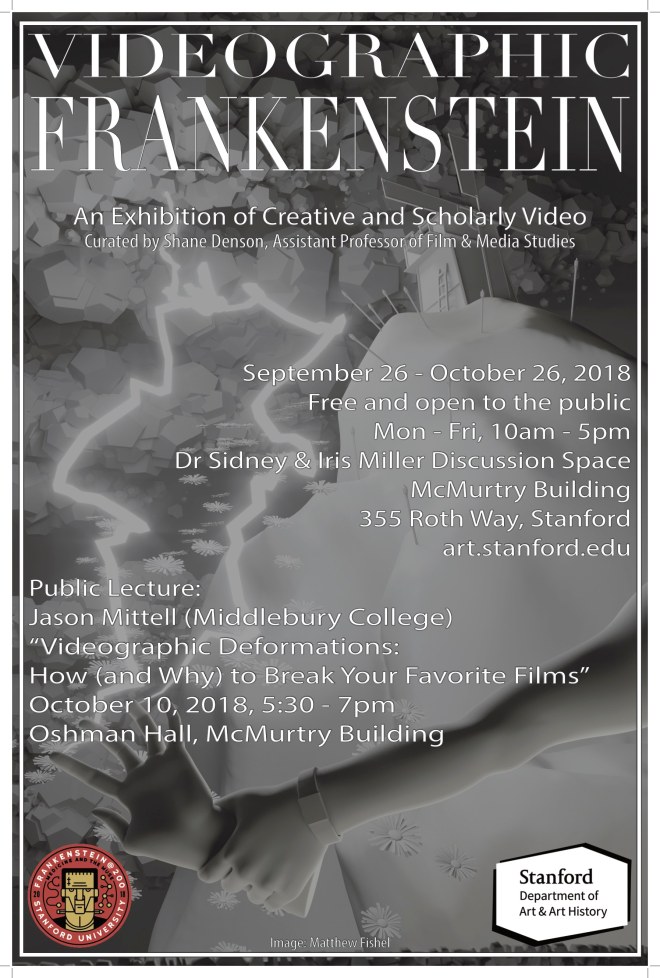
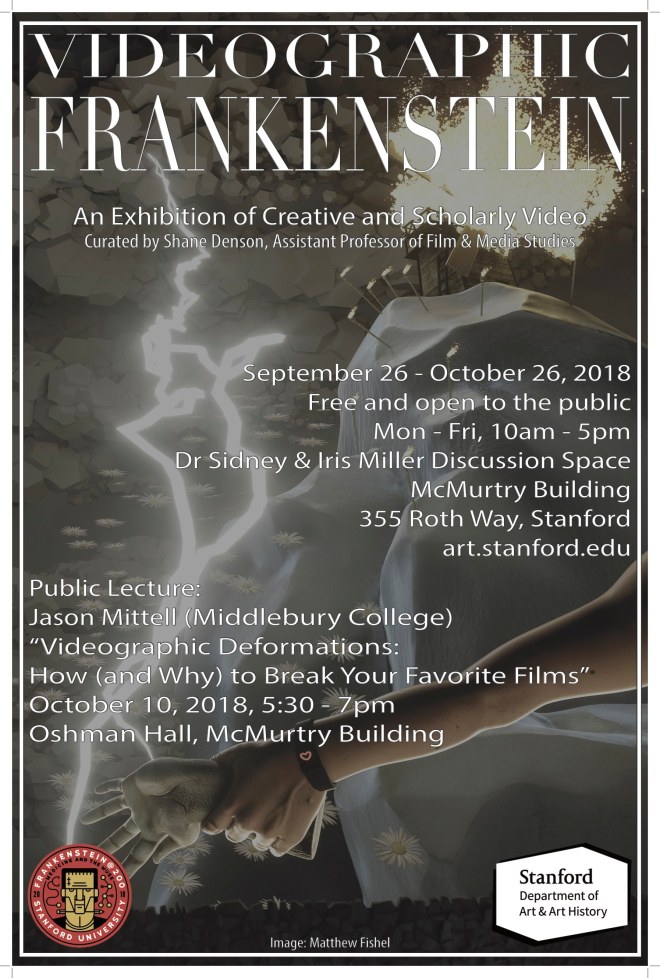
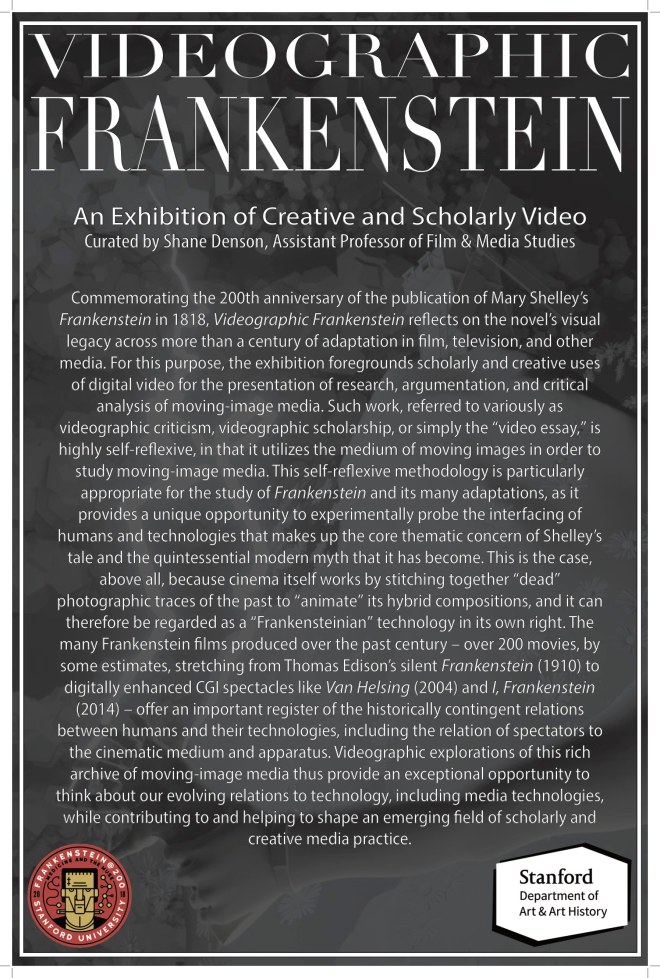
Videographic Frankenstein–the exhibition that I am curating at Stanford–opens today. The show runs from Sept. 26 through Oct. 26, 2018 in the Dr. Sidney and Iris Miller Discussion Space, McMurtry Building.

Videographic-Frankenstein-Poster-large-bw

Works featured:

Frankenstein (2018), 2018
Matthew Fishel
Silent Animation Loop

Spark of Being, 2010
Bill Morrison
Found Footage Film, 1:07:11

Frankenstein’s Television, 2018
Jason Mittell
Video, 10:02

Mad Science/Love and the Body in Pieces, 2018
Allison de Fren
Video, 17:18

The Meaning of “Animation” in Edison’s FRANKENSTEIN, 2017
Shane Denson
Video, 12:57

Red, Not Blood: Godard, Frankenstein, and Eastman Red, 2018
Carlos Valladares
Video, 6:46

Persona versus Frankenstein, 2015
David Verdeure, a.k.a. Filmscalpel
Video, 4:15

On Galvanism: Electricity, Frankenstein, and the Moving Image, 2018
Spencer Slovic
Video, 7:30

Sight and Sound Conspire: Monstrous Audio-Vision in James Whale’s FRANKENSTEIN (1931), 2015
Shane Denson
Video, 8:47

Questioning the Human Machine in EX MACHINA, 2016
Allison de Fren
Video, 10:26

Horror and Humor: Frankenstein’s Comic Offspring, 2018
Lester D. Friedman and Kristine Vann
Video, 17:38

The exhibition was made possible by a Frankenstein@200 Initiative grant from the Medicine and the Muse Program at Stanford.

frankenstein-logo-no-border

More information about the exhibition can be found here.

Theory into Practice: The Audiovisual Essay

olomouc

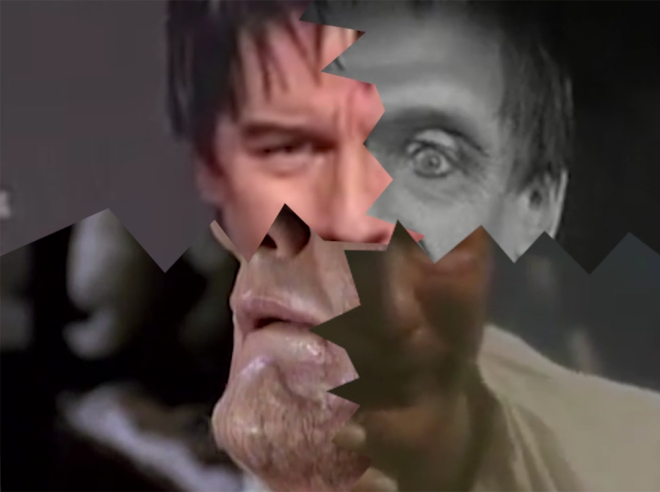
From September 29 – October 6, 2018, I will be in Olomouc, Czech Republic for the intensive course “Theory into Practice,” focusing this year on “The Audiovisual Essay.” This is a bilateral program between the Goethe Universität in Frankfurt am Main and Pálacky University in Olomouc, which Bernd Herzogenrath has been conducting for a decade or so. I am excited to be working with him and the students from Germany and Czech Republic this year, and to explore new possibilities in moving-image media at the intersection of theory and practice (or, as the GIF above suggests, a mix of blah-blah-blah and breaking stuff…).

Jason Mittell: “Videographic Deformations: How (and Why) to Break Your Favorite Films” — Oct. 10, 2018


Frankenstein's Television headshot copy

In conjunction with the exhibition Videographic Frankenstein (Sept. 26 – Oct. 26, 2018 in The Dr Sidney & Iris Miller Discussion Space, McMurtry Building, Stanford), television scholar and video essayist Jason Mittell (Middlebury College) will deliver a public lecture titled “Videographic Deformations: How (and Why) to Break Your Favorite Films.”

The lecture, which takes place at 5:30pm on October 10, 2018 in Oshman Hall (McMurtry Building), is in conversation with Frankenstein’s Television, Mittell’s contribution to the exhibition, and with a broader set of methodological concerns around the idea of “deformative” methods:

Deformative criticism has emerged as an innovative site of critical practice within media studies and digital humanities, revealing new insights into media texts by “breaking” them in controlled or chaotic ways. Media scholars are particularly well situated to such experimentation, as many of our objects of study exist in digital forms that lend themselves to wide-ranging manipulation. Building on Jason Mittell’s experiments with Singin’ in the Rain and his “Frankenstein’s Television” video (included in Stanford’s Videographic Frankenstein exhibit), this presentation discusses a range of deformations applied to film and television, considering what we can learn by breaking a media text in creative and unexpected ways.

Jason Mittell is Professor of Film & Media Culture and American Studies, and founder of the Digital Liberal Arts Initiative at Middlebury College. His books include Complex Television: The Poetics of Contemporary Television Storytelling (NYU Press, 2015), The Videographic Essay: Criticism in Sound and Image (with Christian Keathley; caboose books, 2016), and co-editor of How to Watch Television (with Ethan Thompson; NYU Press, 2013). He is project manager for [in]Transition: Journal of Videographic Film & Moving Image Studies, co-director of the NEH-supported workshop series Scholarship in Sound & Image, and a Fellow at the Peabody Media Center.

See here for more information.

FrankensteinsDeepDream

Creation scene and aftermath, as described in Mary Shelley’s Frankenstein (Chapter 5, 1831 edition) and interpreted by Cris Valenzuela’s text-to-image machine-learning demo (http://t2i.cvalenzuelab.com) utilizing AttnGAN (Attentional Generative Adversarial Networks).

Made for the upcoming Videographic Frankenstein exhibition at the Department of Art & Art History, Stanford University (Sept. 26 – Oct. 26, 2018). More info here: https://art.stanford.edu/exhibitions/videographic-frankenstein

Criticism in Moving Images: The Video Essay in Theory and Practice (Sydney)

Screen Shot 2018-08-21 at 8.02.38 AM

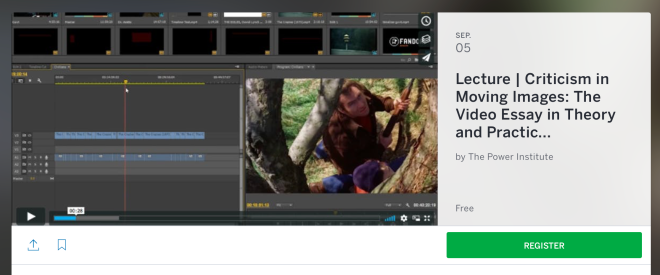
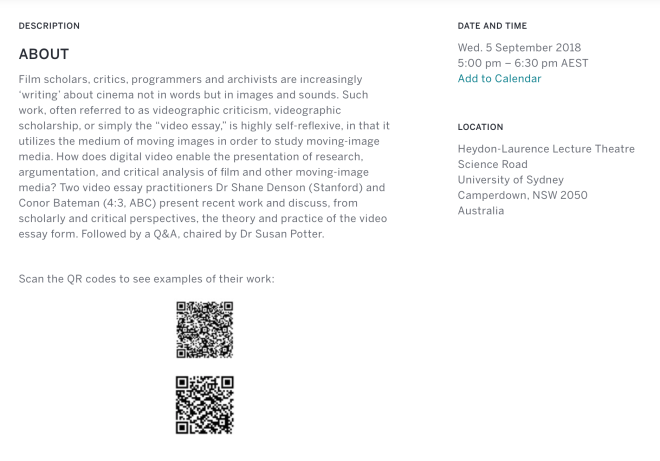
“Criticism in Moving Images: The Video Essay in Theory and Practice” is the first of three events I’ll be involved in during a trip next month to Australia. On September 5 at the Power Institute (University of Sydney), Conor Bateman and I will present and discuss videographic work in conversation with Susan Potter:

Screen Shot 2018-08-21 at 8.08.42 AM

See here for more info, and register here.

Virtual and Augmented Reality Digital (and/or Deformative?) Humanities Institute at Duke

I am excited to be participating in the the NEH-funded Virtual and Augmented Reality Digital Humanities Institute — or V/AR-DHI — next month (July 23 – August 3, 2018) at Duke University. I am hoping to adapt “deformative” methods (as described by Mark Sample following a provocation from Lisa Samuels and Jerome McGann) as a means of transformatively interrogating audiovisual media such as film and digital video in the spaces opened up by virtual and augmented reality technologies. In preparation, I have been experimenting with photogrammetric methods to reconstruct the three-dimensional spaces depicted on two-dimensional screens. The results, so far, have been … modest — nothing yet in comparison to artist Claire Hentschker’s excellent Shining360 (2016) or Gregory Chatonsky’s The Kiss (2015). There is something interesting, though, about the dispersal of the character Neo’s body into an amorphous blob and the disappearance of bullet time’s eponymous bullet in this scene from The Matrix, and there’s something incredibly eerie about the hidden image behind the image in this famous scene from Frankenstein, where the monster’s face is first revealed and his head made virtually to protrude from the screen through a series of jump cuts. Certainly, these tests stand in an intriguing (if uncertain) deformative relation to these iconic moments. In any case, I look forward to seeing where (if anywhere) this leads, and to experimenting further at the Institute next month.

Carlos Valladares’s Video Essay “Minnelli Red” at Pesaro Film Festival

Screen Shot 2018-06-20 at 10.11.07 AM

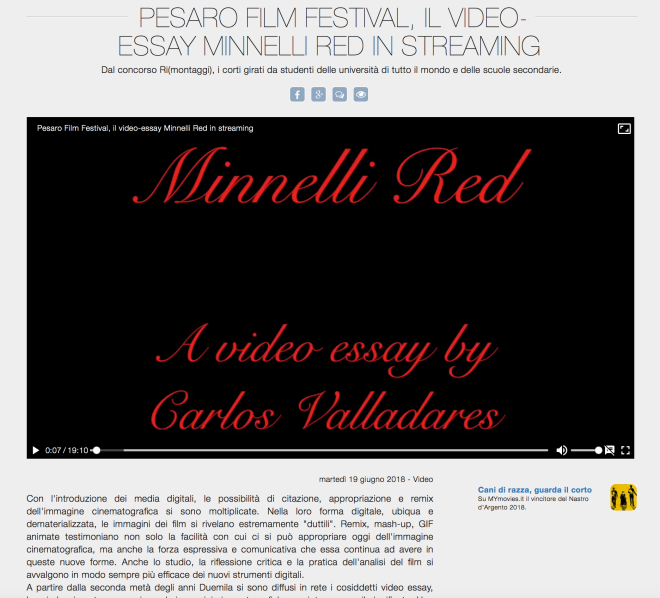
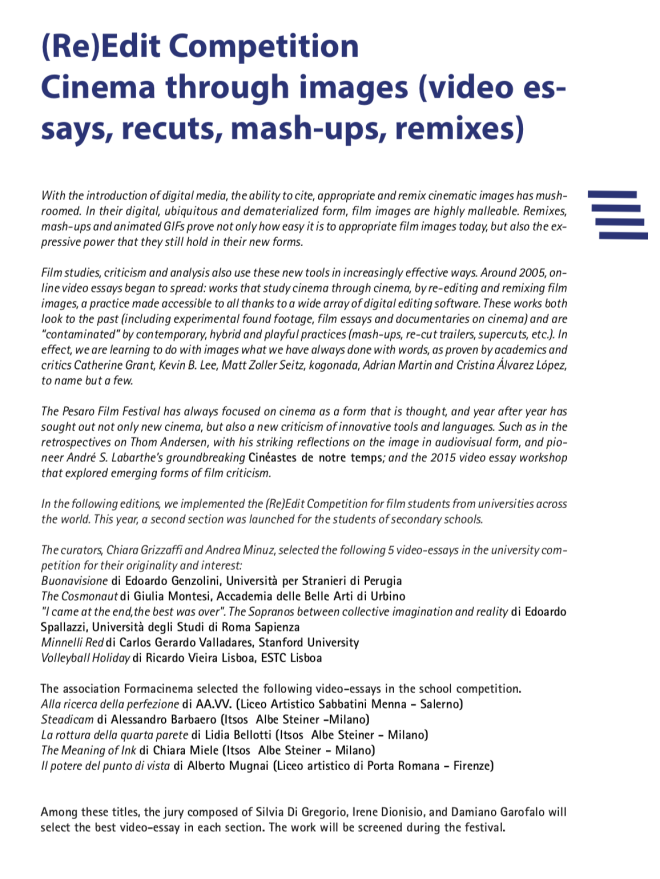
Congratulations to Carlos Valladares, who not only graduated with honors from the Stanford Film & Media Studies program this past weekend, but whose video essay “Minnelli Red” was accepted at the Pesaro Film Festival taking place right now in Pesaro, Italy!

Valladares’s video essay, a revised version of his final project for the seminar I taught on “The Video Essay: Writing with Video about Film and Media” last fall, is one of five entries selected by curators Chiara Grizzaffi and Andrea Minuz in the festival’s “(Re)Edit Competition” and is now in the running for a juried award. Good luck, Carlos!

Screen Shot 2018-06-20 at 10.09.59 AM

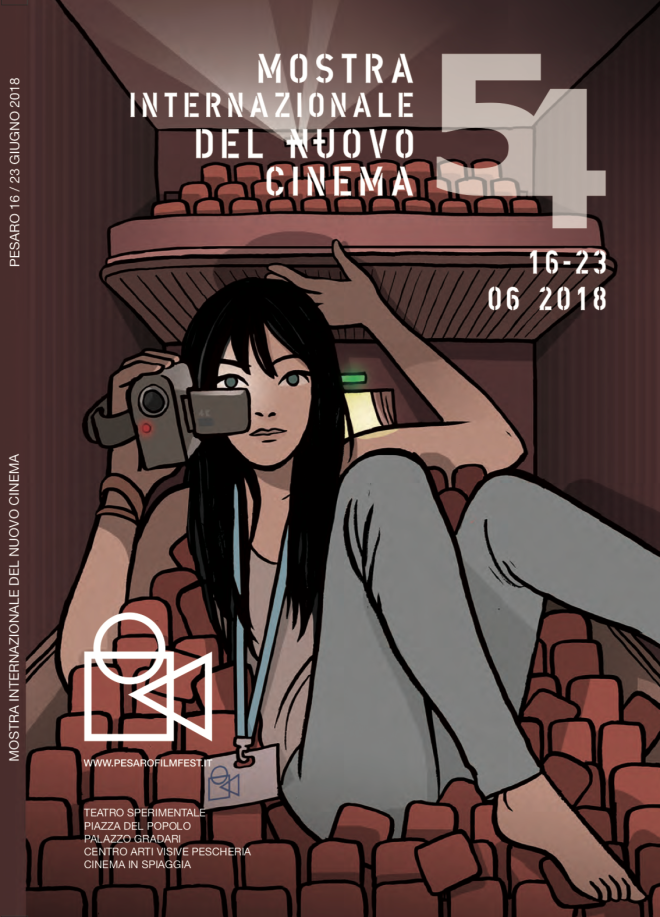
The complete catalog (PDF) for the 54th Pesaro Film Festival is available here:

Screen Shot 2018-06-20 at 10.10.30 AM.png

Slowness and Slow Cinema

Screen Shot 2018-05-13 at 6.49.07 PM

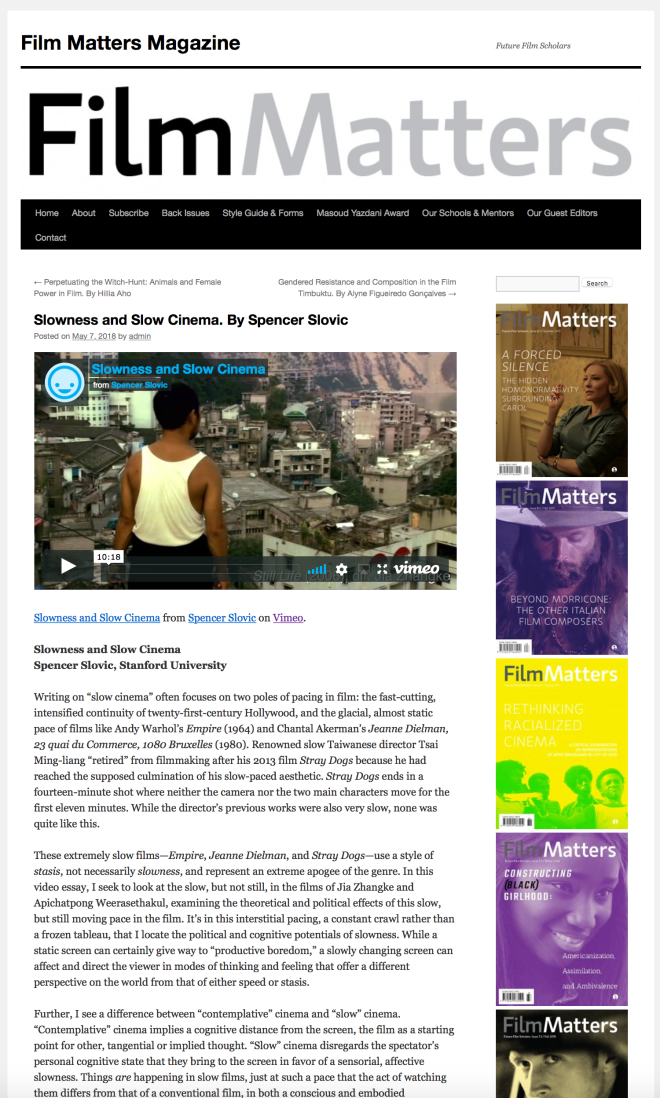
My student Spencer Slovic has just published an excellent video essay on “Slowness and Slow Cinema” at Film Matters, which will be of interest to people thinking about contemporary and world cinema, or simply interested in the medium of the video essay (and this is a very good one!).

Spencer’s video grew out of an assignment for my “Post-Cinema” seminar, which I taught in the winter quarter of 2017. An earlier version was featured in the exhibition I curated at Stanford, Post-Cinema: Videographic Explorations (you can still see all of the videos online).

In any case, the version featured in Film Matters is much improved, having gone through a rigorous peer-review process. Take a look!

Visualizing Digital Seriality — Demo Videos

2017-08-15 01.23.20 pm

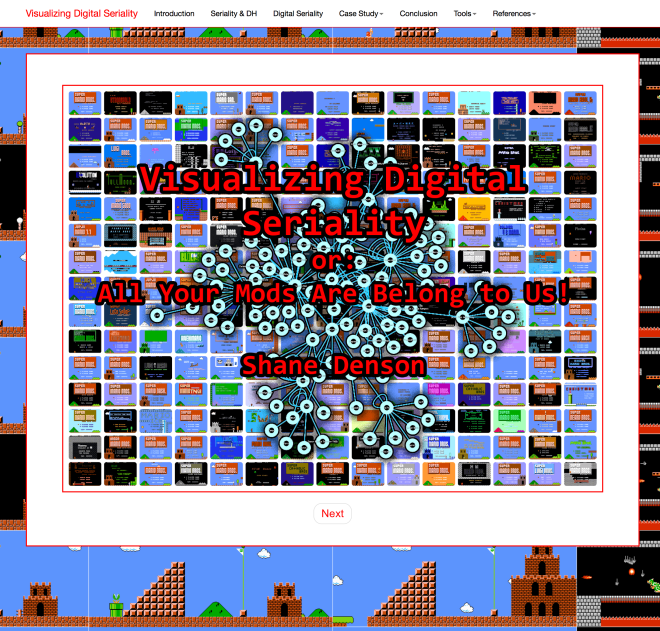
The short videos below (all under 1 minute in length) demonstrate the interactive components included in “Visualizing Digital Seriality, Or: All Your Mods Are Belong to Us!”—a digital humanities/critical code studies project utilizing visualization and other software tools to study exchanges of code and community-building in the Super Mario Bros. modding scene—published in Kairos: A Journal of Rhetoric, Technology, and Pedagogy 22.1 (August 2017): http://kairos.technorhetoric.net/22.1/topoi/denson/index.html

The videos, which use IBM Watson’s text-to-speech generator for voiceovers, were produced just in case any of the interactive functions ever stop working, but they also serve to show what you can do with my webtext (as Kairos refers to this type of multimodal scholarship).

1 – Mods & Interfaces

This page allows users to filter and sort the title screens of 240 Super Mario Bros. mods, all taken from ROMhacking.net’s database. Sorting and filtering can be done by year, by modder, and by mod name, as well as through a quick search via text input. Dropdown lists appear when the mouse hovers over “Year,” “Modder,” or “Title,” allowing the user to select parameters by checking the relevant boxes. Sorting can be done with the buttons below: “Sort by Date,” “Sort by Modder,” or “Sort by Mod Title.”

http://kairos.technorhetoric.net/22.1/topoi/denson/screens-page/index.html

2 – Basic Metadata

This page offers visualizations of basic metadata derived from ROMhacking.net’s collection of Super Mario Bros. mods. The interactive visualizations contain basic information on the number of mods released each year, the most active modders, and trends concerning the types of mods being produced. Additional information appears when the mouse hovers over the charts.

http://kairos.technorhetoric.net/22.1/topoi/denson/visualizations/basic-metadata.html

3 – Modder Networks (default view)

This interactive network graph visualizes the social networks among modders, as revealed in paratextual references in files distributed with mods (i.e. “shout-outs” in README.TXT and similar accompanying files). This is the default view. Each node represents an individual modder, while edges (lines) represent connections between modders. The user can change the visual style and layout via the dropdown menus on the left, as well as zoom in and out with the mouse wheel and rearrange nodes by holding and dragging them. Scrolling is achieved by holding and dragging the background.

http://kairos.technorhetoric.net/22.1/topoi/denson/visualizations/community.html

4 – Modder Networks (concentric view)

This interactive network graph visualizes the social networks among modders, as revealed in paratextual references in files distributed with mods (i.e. “shout-outs” in README.TXT and similar accompanying files). This is a concentrically arranged view. Each node represents an individual modder, while edges (lines) represent connections between modders. The user can change the visual style and layout via the dropdown menus on the left, as well as zoom in and out with the mouse wheel and rearrange nodes by holding and dragging them. Scrolling is achieved by holding and dragging the background.

http://kairos.technorhetoric.net/22.1/topoi/denson/visualizations/community.html

5 – Modder Networks (weighted)

This interactive network graph visualizes the social networks among modders, as revealed in paratextual references in files distributed with mods (i.e. “shout-outs” in README.TXT and similar accompanying files). Each node represents an individual modder, while edges (lines) represent connections between modders. In this view, node size corresponds to the number of references it has received (the more paratextual references, the larger the node). The user can change the visual style and layout via the dropdown menus on the left, as well as zoom in and out with the mouse wheel and rearrange nodes by holding and dragging them. Scrolling is achieved by holding and dragging the background.

http://kairos.technorhetoric.net/22.1/topoi/denson/visualizations/community.html

6 – Modding Communities

This interactive network graph visualizes connections between modders and various online modding communities, as revealed in paratextual references in files distributed with mods (i.e. references to various online communities and modding websites). In the default view, white nodes represent various mod files, while solid red nodes represent communities and websites referenced by them. The user can change the visual style and layout via the dropdown menus on the left, as well as zoom in and out with the mouse wheel and rearrange nodes by holding and dragging them. Scrolling is achieved by holding and dragging the background.

http://kairos.technorhetoric.net/22.1/topoi/denson/visualizations/community.html

7 – Extent of Modification

The visualization on this page offers information about the extent of modification that a given mod patch file instructs the computer to execute with respect to the original Super Mario Bros. ROM. The visualization provides basic numerical information about the amount of change contained in a mod or set of mods. It can be sorted and filtered by modder, mod, or by a range of particular byte addresses with the sliders and checkboxes on the right. The results, displayed on the left, can be sorted by title, year, or modder.

http://kairos.technorhetoric.net/22.1/topoi/denson/visualizations/extent.html

8 – Code “Diff”-Maps (Sorted by Date)

These visualizations offer the core means of conducting a “distant reading” of the code of all 240 Super Mario Bros. mods contained in the data set. Sorted here by date, these Gannt charts depict the location of byte-level modifications in the game ROM. The chart can be filtered by modder, mod title, and year via the checkboxes on the upper right, or by a range of particular byte addresses via the “Start” slider at the bottom right. The results, displayed on the left, can be sorted by date, modder, or title.

http://kairos.technorhetoric.net/22.1/topoi/denson/visualizations/diff-maps-by-date.html

9 – Code “Diff”-Maps (Sorted by Modder)

These visualizations offer the core means of conducting a “distant reading” of the code of all 240 Super Mario Bros. mods contained in the data set. Sorted here by modder, these Gannt charts depict the location of byte-level modifications in the game ROM. The chart can be filtered by modder, mod title, and year via the checkboxes on the upper right, or by a range of particular byte addresses via the “Start” slider at the bottom right. The results, displayed on the left, can be sorted by modder, date, or title.

http://kairos.technorhetoric.net/22.1/topoi/denson/visualizations/diff-maps-by-modder.html

10 – Diff Compare Mods (Patched ROMs)

This page enables low-level analysis of mod files, accessed here through a browser-based hex editor. To use the tool, the user selects two files (from the complete collection of patched ROMs, as well as the original unpatched ROM) from the dropdown menus below and clicks the button “Choose Files.” Afterwards, the hex code and ASCII representation of the patched ROM files will appear in the two boxes, with the differences between them highlighted. Scrolling is synchronized between the files displayed in the left and right boxes.

http://kairos.technorhetoric.net/22.1/topoi/denson/hexdump-diff/hexdump-diff.html

11 – Diff Compare Patch Files (Unpatched .ips Files)

This page enables low-level analysis of mod files, accessed here through a browser-based hex editor. To use the tool, the user selects two files (from the complete collection of unpatched .ips format patch files) from the dropdown menus below and clicks the button “Choose Files.” Afterwards, the hex code and ASCII representation of the patch files will appear in the two boxes, with the differences between them highlighted. Scrolling is synchronized between the files displayed in the left and right boxes.

http://kairos.technorhetoric.net/22.1/topoi/denson/hexdump-diff/ips-hexdump-diff.html